Products
Features
- Ready-to-use RNA-seq analysis pipelines powered by QIAGEN CLC algorithms
- Compatible with most commonly used library preparation kits
- Easy, intuitive exploration and filtering of differentially expressed genes in a user-friendly interactive dashboard
- Interpretation support through annotation with the top impacted pathways, upstream regulators, diseases and functions queried from the QIAGEN Ingenuity Pathway Analysis (IPA) Knowledge Base
- Decision-making support on biomarker verification experiments with product recommendations and convenient custom design tools in the QIAGEN GeneGlobe Design & Analysis Hub
Product Details
GeneGlobe Analyze solutions combine industry-leading algorithms and knowledge with ease-of-use. The cloud-based QIAGEN RNA-seq Analysis Portal is accessible from GeneGlobe Analyze and enables analysis of RNA-seq data, from alignment of raw reads to interpretation of differentially expressed genes and finding the right tools for verification of potential biomarkers.
Performance
The QIAGEN RNA-seq Analysis Portal cuts down analysis time from days to just a few hours:
- microRNA analysis: requires just 90 minutes from fastq file to differential expression (based on data from QIAseq miRNA Library Kit, 96 samples with ~5M reads per sample, single-end 75 bp reads)
- Whole transcriptome analysis: requires just 4 hours from fastq file to differential expression (based on data from QIAseq Stranded RNA Library Kit, 96 samples, 60M reads per sample, paired-end 2 x 75 bp reads)
Principle
The QIAGEN RNA-seq Analysis Portal benefits your research in many ways:
- Complete autonomy: take full control of your RNA-seq pathway and biomarker discovery with a fully integrated analysis pipeline
- Save time: accelerate your research and cut down analysis time from days to just a few hours
- Focus on insights: easily manage your data, explore and filter in a interactive web-based dashboard, decide on potential biomarkers and find the right assays to verify these within a single interface
- Save IT-related costs: cloud-based analysis pipelines let you scale up your projects and access computing power to have results ready in a few hours
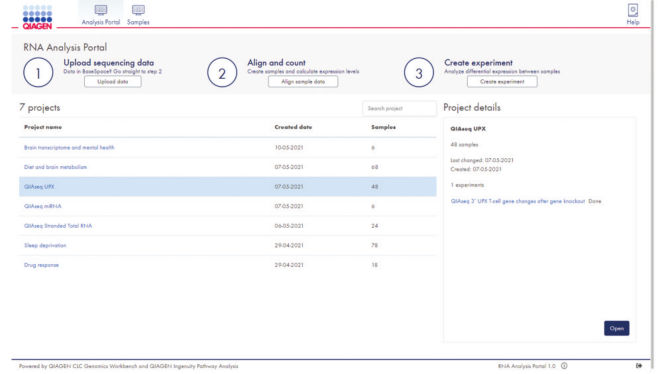
The portal's user-friendly project interface allows data upload and setup of new experiments in just three easy steps (see figure GeneGlobe RNA-seq Analysis Portal projects overview). After alignment, gene counts are generated, and QIAGEN CLC Genomics Workbench algorithms are leveraged to perform differential gene expression analysis based on user-defined experiment groups.
The set of differentially expressed genes is evaluated for its likely impact on canonical pathways, diseases and functions, and upstream regulators driving the expression of these genes are predicted (see figure Interactive results dashboard). The portal displays the top ten of each type from the QIAGEN Ingenuity Pathway Analysis (IPA) Knowledge Base. A full license for QIAGEN IPA is needed to view and explore the complete set of biological interpretations.
Sample and quality control include the experimental setup and design, overview of samples in the experiment and commonly used QC metrics like read trimming and mapping statistics, principal component analysis and biotype distribution (see figure QC including RNA biotype distribution).
The results dashboard directly interfaces with QIAGEN's GeneGlobe Design & Analysis Hub, where differentially expressed genes can be explored and filtered based on p-value and fold change and saved to your personal My Projects space in My GeneGlobe. The right tools are also recommended for biomarker verification experiments (see figure Products for biomarker verification in GeneGlobe), and the saved genes or miRNAs of interest can be further explored in the context of pathways, functions and publications (see figure Pathway maps in GeneGlobe).
For more information on the principle and technical background, refer to the RNA-seq Analysis Portal User Manual.
See figures
Applications
For RNA-seq data analysis, including:
- Support for human, mouse and rat samples
- Alignment of raw reads generated by Illumina instruments
- Gene counts and differential gene/miRNA expression analysis
- Sample QC for the differential expression experiment
- Annotation of differentially expressed genes/miRNAs with ten most-impacted pathways, upstream regulators and downstream diseases/functions
Supports the most commonly used RNA-seq library preps for Illumina instruments:
QIAGEN:
- QIAseq UPX 3’ Transcriptome Kit
- QIAseq miRNA Library Kit
- QIAseq Stranded RNA Library Kit
- QIAseq FastSelect –rRNA HMR Kits
Illumina:
- TruSeq Stranded Total RNA Library Prep (Human/Rat, Gold, Globin)
- Illumina Stranded Total RNA Prep with Ribo-Zero Plus
New England Biolabs:
- NEBNext UltraTM II Directional RNA Library Prep Kit for Illumina
Roche Sequencing solutions:
- KAPA RNA HyperPrep Kit
Takara Bio:
- SMARTer Stranded Total RNA Sample Prep Kit - HI Mammalian
- SMARTer Stranded Total RNA Sample Prep Kit - Low Input Mammalian
Thermo Fisher Scientific:
- Collibri Stranded RNA Library Prep Kit for Illumina Systems
Supporting data and figures
GeneGlobe RNA-seq Analysis Portal projects overview.


